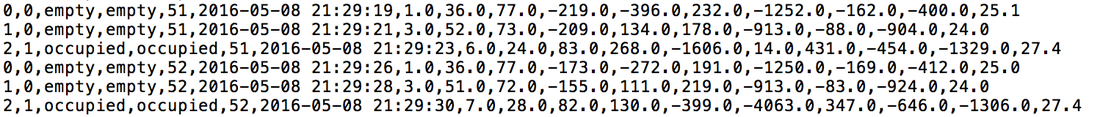
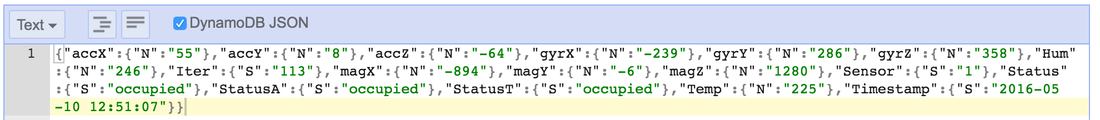
Raw Data
Below is an example of our collected raw data used for further processing. As can be seen, the start of the collection involves calibration of the sensors so that later data have a standard to compare against. Here occupancy of 0 indicates empty, 1 indicates occupied, and 2 indicates uncertain. Even though we only use a subset of the data that WICED™provides, we list most of the provided data here for completeness.

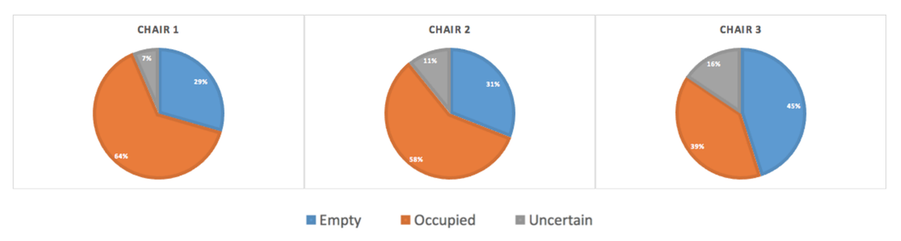
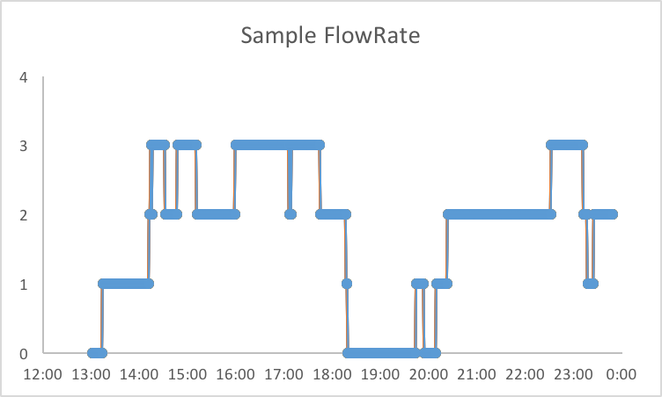
Data Analytics
Below are some graphs showing the results of our data analysis. The top graph shows a pie chart of the seat occupancy of three chairs throughout the day. The bottom graph converts the percentage data into an accumulative flow rate of the three seats, as an example of the type of information that the Smart Seats can provide regarding the library usage.